In the fast-paced and data-driven world of business, information is power. Companies collect vast amounts of data from various sources to uncover valuable insights. It helps them in their strategies and decision-making. In this article, we will explore the importance of data visualization in business. We will discuss – “Why Data Visualization Matters: Turning Information Into Insights” Sometimes small decision make big impact

“The greatest value of a picture is when it forces us to notice what we never expected to see.”
John Tukey,Pioneer in the field of data visualization
Why Data Visualization Is Important?
Data Visualisation is the key ingredient or a powerful tool. It completely transforms data into more pleasing and appealing data compositions. it takes hours to read and process information, making it a very monotonous and dull activity. Now, with the help of pictures, the same idea become clearer and more interesting. Step into a world where machines learn, adapt and make decisions that can shape your financial destiny
The power of visualization – makes the text easier, more pleasing. There is a better understanding of audience engagement otherwise lost due to monotonic.
Humans comprehend shapes and colors more than number lists. So thinking about form and function is necessary when converting data into pictures. Your data is more understandable and accessible by a picture. It is crucial in the digital ecosystem as analytic data involves complexity.
You must break it down into manageable portions to get the most out of anything.
Also Read:
- Time Management: Mastering Discipline for Unleashing Success
- Newspaper Press Modernization: Extending Asset Life
The Power of Data Visualization: Captivating Visuals, Clear Insights
Audience
First, tailor your report for a particular audience. Consider the level of knowledge of your audience.
Context
Presenting data in a context is the fundamental guideline when doing so. Simple numerical data won’t be very illuminating. Include any titles, notes, and units that apply. Use a different chart or graph depending on the specific situation.
Content
For instance, you can use line charts to present rapid revenue trends. But when you need to show a correlation between two variables, use a scatter plot. For example, when you measure your site views about time spent on a site, use MS Excel.
Layout
The layout should be practical and logical, so your audience can navigate it easily without needing too much effort to find the whys and wherefores behind their data.
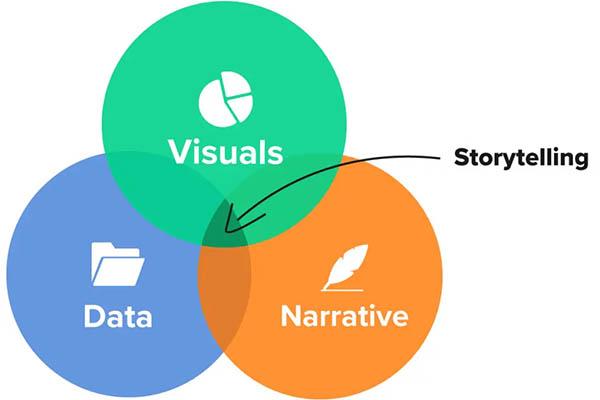
Data Storytelling
Translates analyses into understandable terms to influence business decisions or actions. Data analysis focuses on creating valuable insights from data to give further context and understanding to an intended audience.
Reports need to tell a story in a simple and visual way. We needed something that was going to connect with a lot of different channels and tools, and we needed the confidence it was going to pull the correct data.
Brian Ferritto
With only charts, dashboards and data visualization tools, decision-makers in an organization might not understand what a specific amount of data means. So instead of looking at it from a data-driven perspective, data storytelling wraps that data in a more understandable narrative.
Importance of Data Storytelling
In the realm of data-driven decision-making, data storytelling holds a paramount significance. Beyond mere numbers and charts, data storytelling brings data to life. It crafts compelling narratives. Businesses are now able to communicate complex information. This empowers stakeholders to make informed choices with clarity and confidence.
- Data storytelling is effective for non-experts:
- It helps them understand insights from data.
- Overcoming data overload: Makes it easier to find meaning and remember data.
- Clarity and memorability: Engagingly presents data for better understanding and empathy.
- Enhancing comprehension: Goes beyond just presenting numbers, making data more accessible.
- Compelling and memorable data presentation: Leaves a lasting impact on the audience.
Comparing with Clarity: The Role of Visual Consistency

Comparison is the key to understand why Big 4, firms, and Startups use Data Visualization. Comparisons in data records, readings from the previous year versus the current year. Comparisons within the same company, and comparisons of ROI (return on investment). Understanding Importance of Data Visualization in Business, it is easy to compare anything.
Include a zero baseline
Although a line chart should not begin at zero, it should be if it provides more context for Comparison. You can truncate the scale to highlight data discrepancies if they are tiny. For example- stock market data.
Go with most effective visualization
For the reader to be able to compare at a glance, you want visual consistency. This could entail using a line chart, a group of bar charts, or stacked bar charts. Avoid overwhelming the reader by making them compare too many things.
Be aware of where you are
Even with two well-stacked bar charts to compare points for your reader. If the charts are too far away for the reader to “get” the Comparison, you’ve already lost.
Tell the entire tale. Your Q4 sales increased by 30%. Exciting! But what’s more thrilling? Demonstrating that your sales have increased by 100% from Q1.
Also Read: 10 Golden Rules to Write a Blog: Step by Step Guide
Data Visualization techniques
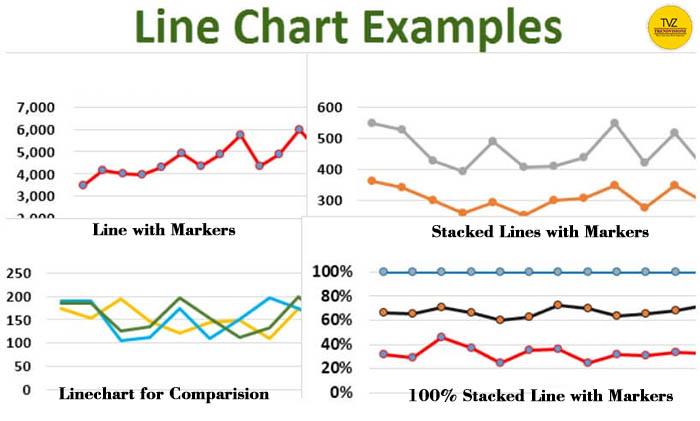
Line Chart
Shows trends over time, which is ideal for tracking changes and patterns.
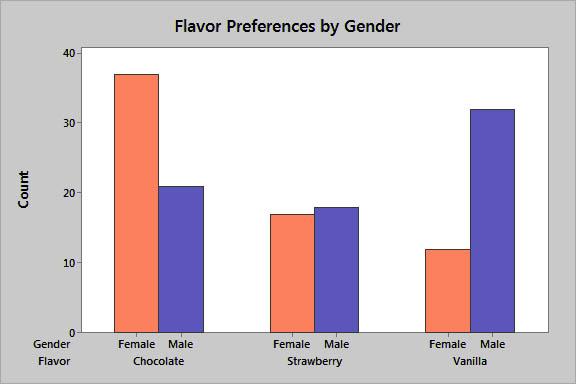
Bar Chart
Compares categories, useful for visualizing discrete data points.
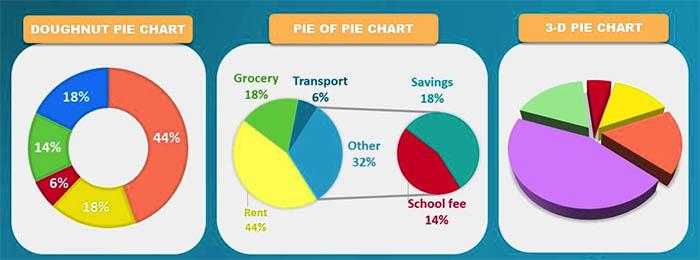
Pie Chart
Illustrates proportions and percentages as a whole.
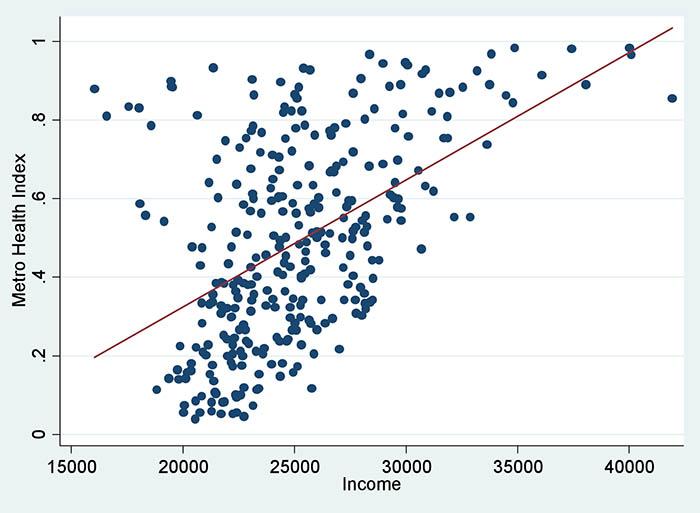
Scatter Plot
Represents the relationship between two variables, helpful for identifying correlations.
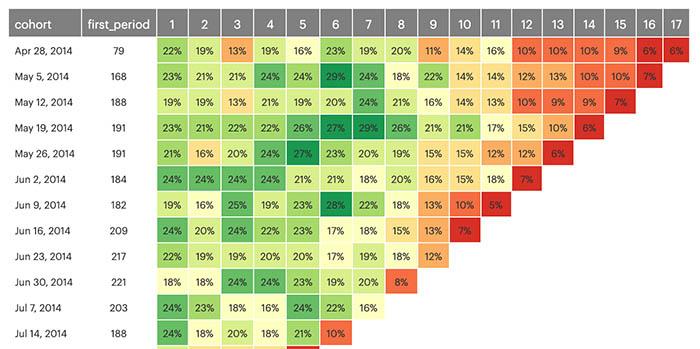
Heat Map
Displays data using colour gradients, excellent for visualizing patterns in large datasets.
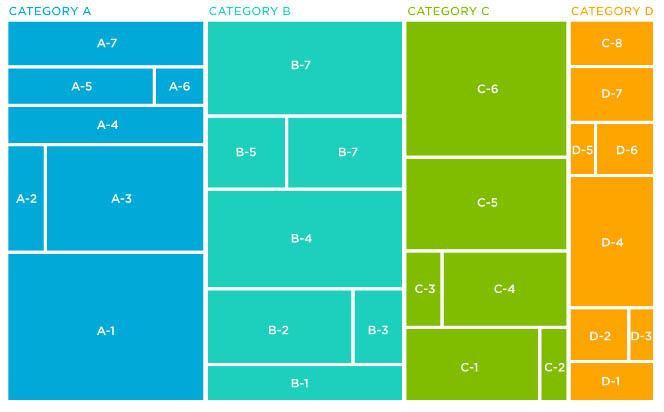
Tree Map
Hierarchical data representation, ideal for comparing proportions within groups.
These are a few examples of the wide variety of data visualizations available. Each suited to different types of data and analysis goals.
The Benefits of Data Visualization
There are many benefits to using data visualization in business. Here are a few of the most important benefits:
- Improved decision-making: Data visualization gives a clear and concise overview of their data. Businesses can analyze trends and patterns to identify areas to improve. And make due changes
- Increased employee engagement: Data visualization can help to increase employee engagement. When employees see and understand the data, they involve themselves in decision-making.
- Better communication with stakeholders: Data visualization can help businesses communicate their data more . Businesses can create appealing and easy-to-understand visualizations. This helps stakeholders understand the data and make informed decisions
5 Powerful Data Visualization Tools
Business success must turn complicated information into clear, actionable insights in today’s data-driven world. Data visualization tools are an important part of this effort because they allow companies to show data in a way that is both visually appealing and easy to understand. Here, we look at five of the best data visualization tools to help you better analyse data and see what’s hiding in your datasets.
Tableau: Brings Analytics to Life
Tableau is one of the best tools for visualizing data. Its drag-and-drop layout makes it easy for both experts and beginners to use. It has many customizable charts, graphs, and dashboards let users look at data from different views. Tableau lets businesses make quick choices based on accurate information because it can connect to real-time data.
Microsoft Power BI : Turn Data into Opportunity
Part of the Microsoft environment, so it works well with other Microsoft programs. This tool makes it easier to prepare data and offers live visualizations, insights from AI, and ways to work together. Its service is in the cloud, so reports and dashboards are easy to reach from anywhere.
Google Data Studio: Unlock the Power of Data
Google Data Studio is a free, easy-to-use tool that works well with Google Analytics and Google Sheets, among other data sources. It has dynamic, engaging dashboards that people can share and work on in real-time. This makes it a great choice for teams.
QlikView : Modern Analytics
Stands out because its associative data indexing lets users naturally study the relationships between data. It has flexible dashboards and powerful data exploration tools, making it perfect for finding useful insights in large datasets.
Plotly : Low Cost Data App
Plotly is a flexible data display tool that lets you make different charts, including 3D and interactive ones. With APIs in multiple programming languages, Plotly is popular among data scientists and developers who want to make interactive data visualizations for web apps.
Adding the right data visualization tool to your business toolkit can change how you understand and show data. These five tools for visualizing data have different features and powers to meet different needs and levels of expertise. Whether you are a data analyst, a business leader, or someone who wants to learn more about data, these tools can help you turn data into information you can act on.
How to Create Effective Data Visualizations
A few key principles to follow when creating effective data visualizations. A key to understand- Importance of Data Visualization in Business. The principles include:
- Data visualizations should be easy to understand and interpret. Avoid using too many colors, fonts, or other visual elements.
- Focus on the message: Data visualization aims to communicate a message. Ensure that the visualization is clear and concise. And should highlights the message’s key points.
- Use the right type of visualization: There is no one-size-fits-all solution. The type of visualization you use should be appropriate . And align with the type of data that you are trying to visualize.
- Test your visualization: Once you have created a data visualization, test it with a few people. It is important to ensure it is easy to understand and interpret.
FAQ’s: Importance of Data Visualization in Business
What is a data visualization dashboard?
A data visualization dashboard is an easy-to-use collection of charts and graphs that show real-time insights and key performance factors from different data sources in one place.
What does a data visualization specialist do?
A data visualization specialist’s job is to make visual images of interesting. They use different tools and methods to turn complicated information into visuals.
Conclusion
Combining Importance of Data Visualization in Business results in an engaging story. A story that enables non-experts to comprehend and relate to data. Beautiful data visualization captivates audiences and simplifies complex information.
Emphasizing aesthetics enhances data comprehension and retention. Visual appeal and storytelling together foster an emotional connection with the data. Beautiful data aids better decision-making and encourages further data exploration. Beautiful data plays a crucial role in analytics. And it presents complex metrics and insights in an appealing manner.
Beautiful data promotes a data-driven culture within organizations. This encourages evidence-based decision-making and contributing to success in the digital landscape.
Our Digital Imprints:
Get Connected to us on Linkedin- “Transforming Lives“. Creating the magic. Just – Believe ~ Practice ~ Perform
Bonus- Watch Our 7 Steps to Goal Setting on Youtube Videos NuteqEntertainment
Don’t miss out on our most recent resources and recommendations. Join Trendvisionz online magazine today by subscribing!
Get connected to TRENDVISIONZ to stay updated with latest information. All take time out to check our About Us Page. Incase you want to get in touch with us do Contact us. A shoutout to Guest writers.
4 comments
This is a great article, especially when you’re looking for ways to improve your own projects!
Super talented writer.
Very informative and insightful!! Keep it up
Comments are closed.