
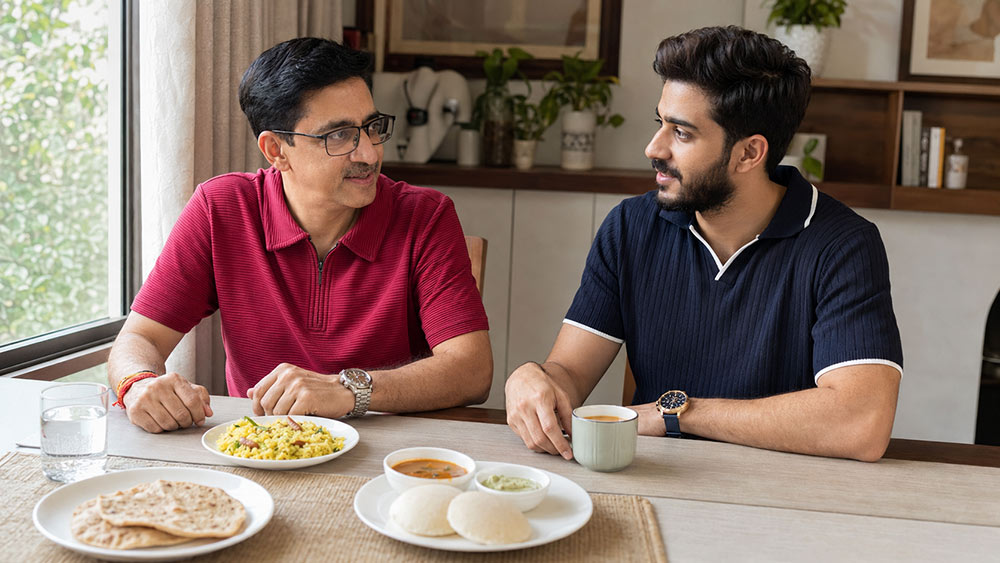
At breakfast, my twenty-three-year-old son, who trains six days a week and studies labels closely, asked about the glycemic load of his meal. I judged food by type, not quantity. When I checked his question against published data, that food list stopped being enough. The portion changed the answer.
That distinction matters after 40. Familiar portions continue by habit as we pay closer attention to blood sugar. Search for how to lower glucose levels quickly and advice usually divides food into good and bad. Glycemic index measures speed; glycemic load adds the carbohydrate in the portion.
Years spent helping healthcare providers build visibility and scale have shown me how health information changes between consultation rooms and social media. I have seen people remove foods from their diet while overlooking the quantity they eat. Once the reasoning is lost, sound advice becomes a rigid rule.
In this edition, I compare glycemic index with glycemic load through eight Indian portions and a practical calculator. If you are over 40 and want clearer portion choices without fearing familiar foods, this is for you.
Also Read:
- Beyond the Myth: Do ‘Functional Foods’ Like Apples Keep Doctors Away?
- Want to Know 7 Healthy Eating Habits: Powerful Balanced Diet Tips
Understanding Glycemic Index and Its Limits
Glycemic index is often treated as a verdict on whether a food is good or bad. That misses what the number measures. A speedometer shows speed, not distance travelled. Similarly, GI describes the glucose response under standard test conditions, not the effect of your serving.
Glycemic index ranks how quickly carbohydrate-containing foods raise blood glucose compared with pure glucose on a 0–100 scale. Glycemic load adds available carbohydrate in the portion eaten, making it more practical for comparing servings, though neither predicts an individual’s response.
How the Glycemic Index Works
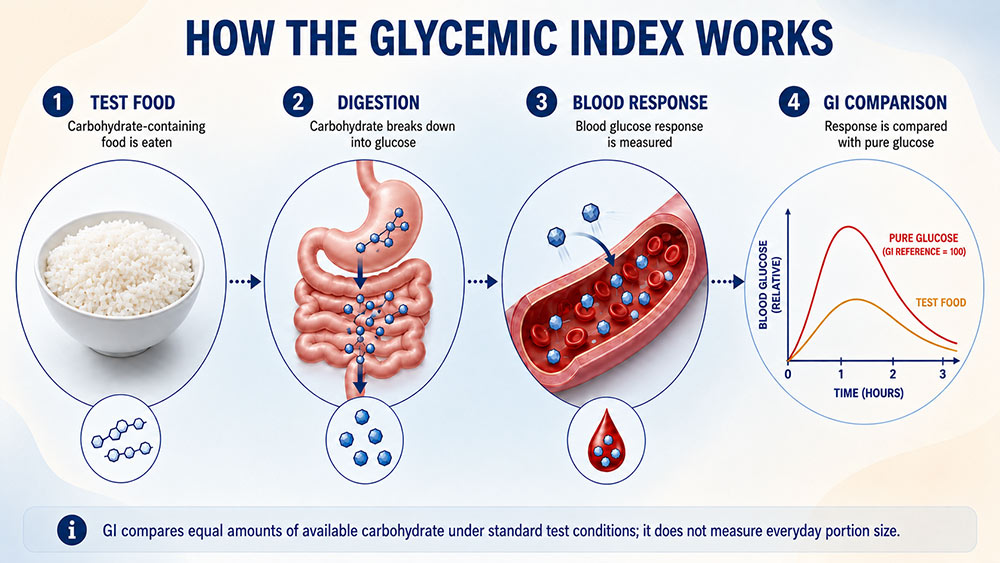
GI compares the blood glucose response after eating a carbohydrate-containing food with the response to pure glucose, which is set at 100.
| GI Classification | GI Range | Relative Response |
| Low GI | 55 or below | Slower |
| Medium GI | 56–69 | Moderate |
| High GI | 70 or above | Faster |
These classifications make GI values easier to interpret. Lower values generally indicate a slower blood glucose response, while higher values indicate a faster response under standard testing conditions.
GI is not a complete nutrition rating. It does not account for the food’s overall nutrient value or the quantity normally eaten. A high-GI food is therefore not automatically unhealthy or unsuitable for every meal.
Glycemic Index Does Not Measure Portions
GI testing compares foods using equal amounts of available carbohydrate. A standard test usually provides 50 grams, although researchers may use 25 grams when reaching 50 grams would require an unusually large or impractical serving. GI and GL research1 examines links between carbohydrate quality, diet and health.
This method makes food comparisons consistent, but it does not reflect the portion someone normally eats. GI therefore describes the food under test conditions while leaving the quantity on an everyday plate outside the calculation.
The glycemic index and the glycemic load should be used in addition to a food’s dietary fiber and whole grain content to assess its health value — Dr David Jenkins, Professor, Departments of Nutritional Sciences and Medicine, University of Toronto
For the same food, a smaller serving reduces available carbohydrate while GI remains unchanged. My takeaway was simple: GI described the food; glycemic load explained the portion on my plate.
Glycemic load accounts for portion size
Glycemic load combines a food’s GI with the available carbohydrate in the portion eaten. A larger serving contains more carbohydrate, so its GL rises while its GI remains unchanged.
Portion advice often relies on words such as moderation: eat less rice or cut down on potatoes. When the serving spoon comes out, “less” is difficult to judge. The GL value makes the carbohydrate impact of that serving easier to compare.
Glycemic load uses two inputs
The formula needs the GI of the specific food and the available carbohydrate in the chosen serving. Both values must refer to the same food and preparation.
GL = (GI × available carbohydrate in the portion) ÷ 100
- GI input: Published GI value for the specific food and preparation
- Portion input: Available carbohydrate in the stated serving.
Available carbohydrate is the carbohydrate your body can digest and absorb from the serving after dietary fibre is excluded.
Example: Same food, different portion
| Roti, 30 g | Roti, 60 g |
|---|---|
| GI = 62 | GI = 62 |
| Available carbohydrate = 20.1 g | Available carbohydrate = 40.2 g |
| GL = 12.5 | GL = 24.9 |
| Category: Medium | Category: High |
Takeaway: The glycemic index stays the same because the food and preparation are unchanged. The glycemic load rises because the larger portion contains more available carbohydrate.
Glycemic load ranges classify servings
These categories apply only to the serving used in the calculation. They do not classify the food permanently or predict an individual’s exact blood glucose response.
- Low glycemic load: 10 or below
- Medium glycemic load: 11–19
- High glycemic load2: 20 or above
These ranges help you compare the portions you actually eat. A low-GI food can still reach medium GL when the serving becomes larger. GI shows how quickly the carbohydrate may affect blood glucose. GL adds the amount present in your serving.
How Should You Balance a High-GL Indian Meal?
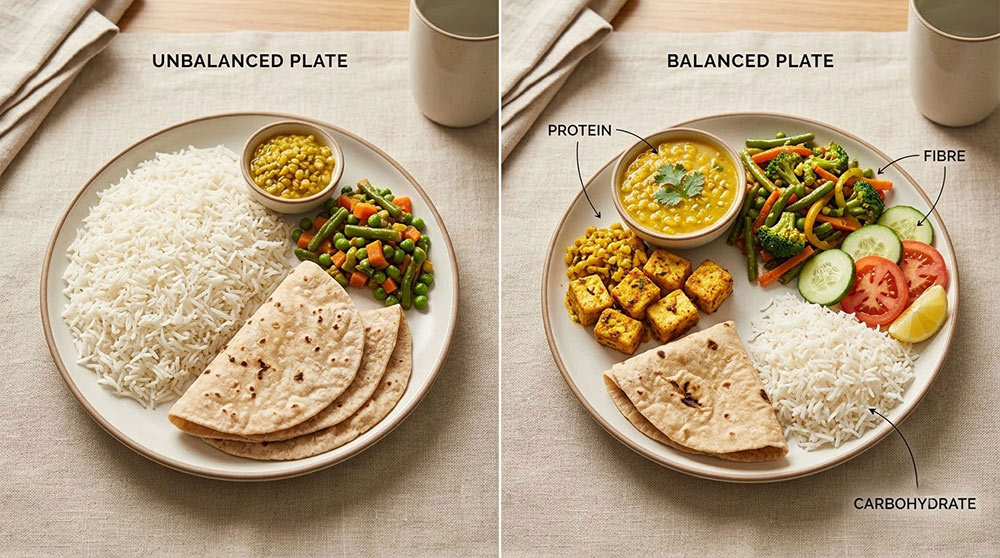
A higher-Glycemic Load staple can be balanced by controlling its portion and adding fibre-rich vegetables, protein or healthy fats. Eating vegetables or protein before the carbohydrate may also moderate the post-meal glucose response. The complete meal matters alongside the GI and GL of individual foods.
The high glycemic load made me curious. I checked published data and discussed the calculation with medical specialists. Comparing familiar foods showed where tested numbers and everyday assumptions did not always agree.
Glycemic Index vs Glycemic Load in Indian Food Portions
The difference between glycemic index and glycemic load becomes clearer when familiar Indian food portions are compared side by side. The GI vs GL distinction becomes practical when portion size enters the calculation. A food may retain its GI category while its glycemic load changes with the available carbohydrate eaten. The label alone cannot show that difference.
I am sharing this Indian food GI and glycemic load chart for eight everyday foods. Serving weights remain visible, allowing you to compare what is actually on your plate rather than rely on a standard value without its portion.
| Food | Serving | GI | GI category | Available carbs (g) | GL | GL category |
| Apple, small | 120 g | 38 | Low | 16.8 | 6.4 | Low |
| Whole wheat roti, 1 medium | 30 g | 62 | Medium | 20.1 | 12.5 | Medium |
| Banana, 1 medium ripe | 120 g | 51 | Low | 27.6 | 14.1 | Medium |
| Idli, 2 pieces | 100 g | 69 | Medium | 24.0 | 16.6 | Medium |
| Boiled potato, 1 medium | 150 g | 78 | High | 25.5 | 19.9 | Medium |
| Basmati rice, boiled | 150 g | 58 | Medium | 37.5 | 21.8 | High |
| Poha, 1 serving | 150 g | 64 | Medium | 37.5 | 24.0 | High |
| White rice, boiled | 150 g | 73 | High | 42.0 | 30.7 | High |
GI and Glycemic Load Categories Can Differ
Boiled potato shows the clearest change. Its GI of 78 is high, but a 150-gram portion has a GL of 19.9. This places it at the upper end of medium, close to high.
Basmati rice moves from a medium GI of 58 to a high GL of 21.8 because its 150-gram portion contains 37.5 grams of available carbohydrate. A medium ripe banana also moves from low GI to medium GL.
For people with diabetes, there is a benefit to choosing foods that have less of an impact on blood sugar levels. But just because something is a low-glycemic food doesn’t mean that it’s necessarily a healthy choice — Kelly Gaines, Employee Wellness Dietitian, Houston Methodist
Does a low-GI food always have a low glycemic load?
No. Glycemic load depends on both GI and the available carbohydrate in the portion eaten. A low-GI food can have a medium or high GL when the serving is large, while a smaller serving may keep its glycemic load lower.
The table changed two assumptions I had carried for years. A low-GI food is not unlimited, and a high-GI food is not automatically forbidden. Portion awareness is one part of learning to manage diabetes naturally through informed food and lifestyle choices
Cooking and Complete Meals Affect Blood Sugar
The same food can produce a different blood sugar response depending on how it is cooked and what accompanies it. Rice eaten alone does not behave like rice served with dal, curd and vegetables. GI and GL provide reference points. Cooking, processing and meal composition complete the picture.
Working with a leading endocrinologist has challenged several food myths I see around me. Someone I know had a high HbA1c despite avoiding sugar in tea, white rice and potatoes. Yet large portions of poha and several rotis remained. Post-meal readings improved after portions were reduced and dal, curd and vegetables were added. The GI categories remained the same. The portions and the plate changed.
Food Preparation and Ripeness Affect Glycemic Index
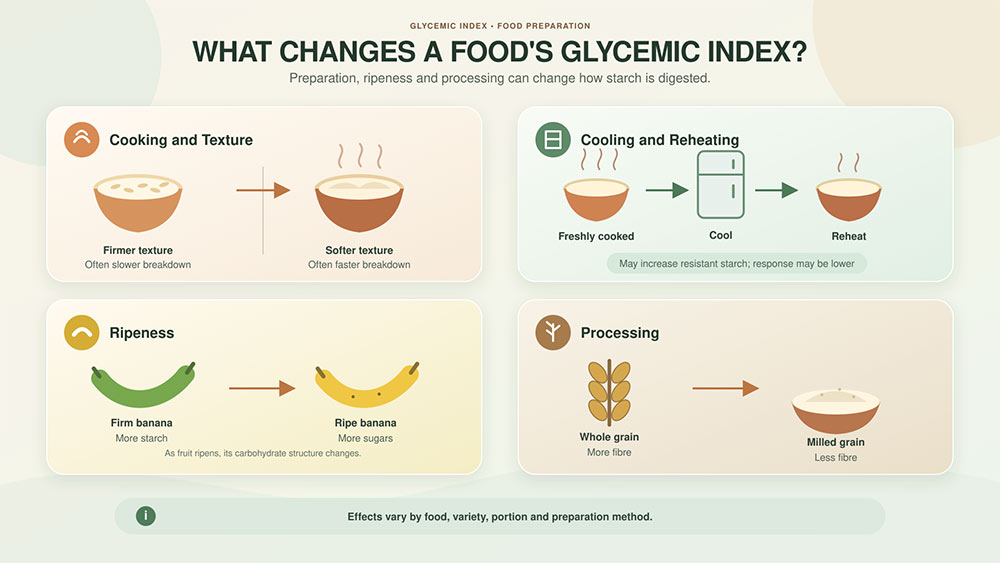
Cooking can change how quickly starch is digested. Longer cooking and softer textures often make starch easier to break down, although the effect varies by food. Trial have shown that white rice refrigerated for 24 hours3 and reheated contained more resistant starch and produced a lower glycemic response than freshly cooked rice. The belief that reheated rice cannot be eaten is incorrect. It can be consumed when cooled, refrigerated and reheated safely.
Ripeness, variety and food processing can also affect a food’s glycemic index. As bananas ripen, starch changes into sugars. Milling can remove fibre and alter how quickly carbohydrate becomes available to the body during digestion.
Mixed Meals Affect Blood Sugar Response
Most people eat carbohydrates as part of a meal. Dal, curd, vegetables, eggs or paneer can change digestion and the post-meal glucose response, even when the staple’s published GI remains unchanged.
- Dietary fibre: Fibre-rich foods can slow carbohydrate digestion. The benefits of eating dietary fibre extend beyond glucose response.
- Protein and fat: Dal, curd, eggs and paneer can slow digestion and make the meal more filling.
- Non-starchy vegetables: Add fibre while reducing the share of rice, roti or potato.
- Meal order: Nutrient sequencing, with vegetables or protein before the staple, may reduce the post-meal rise.
A balanced plate4 also supports gut health. Portion awareness becomes more important with prediabetes. For anyone pursuing insulin resistance reversal, cooking methods and meal composition deserve equal attention each day.
Estimate the Glycemic Load of Your Own Portion
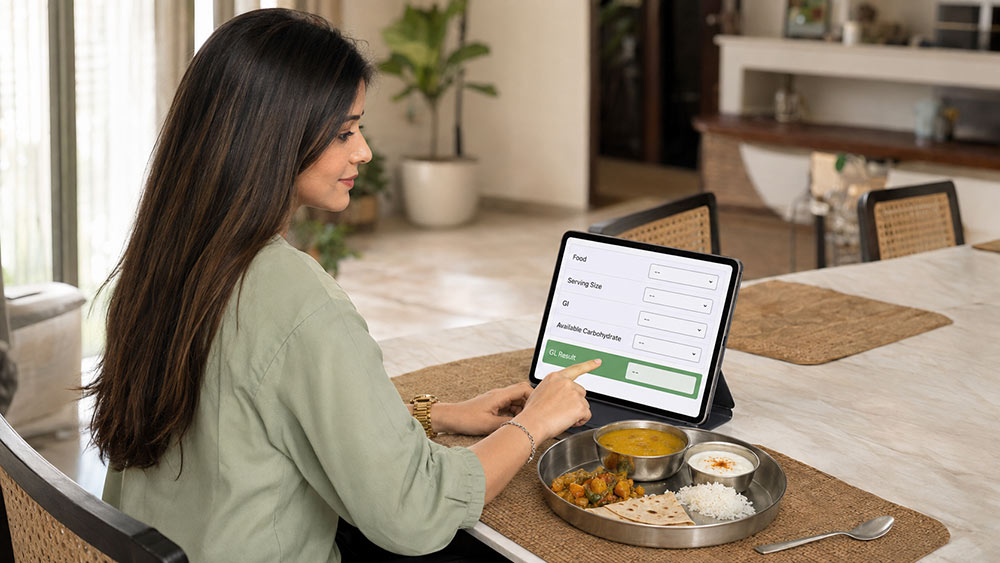
The glycemic load calculator turns the formula into a quick portion check. Choose one of the eight foods from the table, adjust the serving, or enter your own GI and available carbohydrate values. The result estimates the glycemic load of the portion you plan to eat. It makes comparisons between different serving sizes easier to understand.
PORTION-AWARE FOOD GUIDE
Glycemic Load Calculator
Select a food and adjust the portion, or enter your own GI and available carbohydrate values. The result is an estimate for one food portion.
GL = GI × available carbohydrate in the portion ÷ 100
Preset values are estimates and can vary by food variety, ripeness, recipe, processing and cooking method. This calculator is for general information only. It does not predict your personal blood glucose response and must not be used to calculate insulin doses, change medication or determine personalised dietary treatment. Consult a qualified healthcare professional.
- Select or enter: Choose a listed food, adjust its serving, or enter the GI and available carbohydrate for your portion.
- Read the number: The calculator returns the GL for that portion and classifies it as low, medium or high.
- Test the portion: Increase or reduce the serving to see how GL changes while the food’s GI stays fixed.
- Read the meal: Calculate each carbohydrate food separately, then add the results for an approximate GL for the complete meal.
- Treat it as an estimate: The result describes the portion entered. It does not predict your personal glucose reading after eating.
My daughter tested the calculator by changing one serving, and the result made the effect of portion size easy to see. The number remains an estimate. Physical activity, sleep, stress, medication and individual metabolism can change your blood sugar response after a meal. Use GL to compare portions and understand patterns, not to predict an exact reading or replace advice from your healthcare professional.
FAQs: Glycemic Load
Calculate the GL of each carbohydrate-containing food using its GI and the available carbohydrate in the portion eaten. Add those results to estimate the meal’s total glycemic load. Ingredients, cooking methods and serving sizes can change the final estimate.
Yes. Variety, processing, cooking time and texture can affect starch digestion and a food’s glycemic index. Cooling and reheating rice or potatoes may also change the response. Treat published GI and GL figures as practical estimates rather than fixed values.
No. A glycemic load calculator estimates the GL of a stated portion. It cannot predict your exact blood sugar response. Physical activity, sleep, stress, medication, meal composition and individual metabolism can affect your reading after eating.
Also Read:
- Healthy Diet for Women: Essential Nutrition for Every Life Stage
- The New Face of Childbirth in India: What NFHS-6 Is Really Telling Us
Conclusion
My son’s breakfast question stayed with me: how much was I eating? I had judged foods by labels while overlooking the servings on my plate. Understanding glycemic load shifts the focus from eliminating staples to balancing your plate.
The chart challenges assumptions about staple foods and the portions we routinely serve. Familiar foods do not need to disappear from your plate. Their portions become visible, measurable and easier to compare alongside everything you eat during a complete meal.
Balancing carbohydrate portions with protein, fibre, and mindful cooking methods creates sustainable daily habits. Prioritising glycemic load provides a reliable, data-backed approach to metabolic health and steady energy after 40. Portion awareness asks us to serve thoughtfully, not reject familiar foods completely.
At Trendvisionz, our Health coverage examines food choices. Within Preventive Health & Wellness, I share ideas for long-term metabolic health. Through my work, I hope to make healthier choices easier.
Additional Resources:
- Atkinson FS, Brand-Miller JC, Foster-Powell K, Buyken AE, Goletzke J. International tables of glycemic index and glycemic load values 2021: a systematic review. Am J Clin Nutr. 2021 Nov 8;114(5):1625-1632. doi: 10.1093/ajcn/nqab233. PMID: 34258626. ↩︎
- Delage, B. (2016, March). Glycemic index and glycemic load. Linus Pauling Institute, Oregon State University. ↩︎
- Sonia S, Witjaksono F, Ridwan R. Effect of cooling of cooked white rice on resistant starch content and glycemic response. Asia Pac J Clin Nutr. 2015;24(4):620-5. doi: 10.6133/apjcn.2015.24.4.13. PMID: 26693746. ↩︎
- Riccardi, G., Rivellese, A. A., & Giacco, R. (2008). Role of glycemic index and glycemic load in the healthy state, in prediabetes, and in diabetes. The American Journal of Clinical Nutrition, 87(1), 269S–274S. ↩︎
About Anuj Mahajan
Anuj Mahajan is a media entrepreneur, author, filmmaker, and COO of Nuteq Entertainment. With more than 32 years of experience across media, communication, leadership, and business growth, he writes about communication architecture, human behaviour, leadership, mindfulness, business transformation, and decision-making.
He is the Co-Founder of TrendVisionZ, author of three books, creator of the StoryforBusiness podcast, and publisher of the Transforming Lives newsletter.
Explore the Ecosystem
- Explore my work: Nuteq Entertainment | TrendVisionz | Author Profile
- Read my newsletters: Transforming Lives | BizTech Chronicle | Nuteq Newsline
- Guest writer: BizCatalyst360 | Praja Today
- Books: Go Mindfulness: Practices for Professionals Coached
- Join the community: LinkedIn Group – Digital Marketing & Content Creation World
- Connect with me: LinkedIn | Twitter | #StoryforBusiness
- Share your review: Leave your review on Google — your feedback helps us grow.
- Listen on Spotify: Leadership Podcast | Guided NLP (7 Episodes) | Daily Motivation – 21 Episodes
Believe. Practice. Perform.


